Confidence intervals are a fundamental concept in statistics, providing a range of values that are believed to encompass an unknown population parameter. This concept is widely used in various fields, including economics, medicine, engineering, and social sciences, to make informed decisions based on sample data. This article will delve into the confidence interval equation, its components, and its significance.
What is a Confidence Interval?
A confidence interval (CI) is a range of values, derived from sample statistics, that is likely to contain the value of an unknown population parameter. The interval has an associated confidence level that quantifies the level of confidence that the parameter lies within the interval. Common confidence levels include 90%, 95%, and 99%.
The Confidence Interval Equation
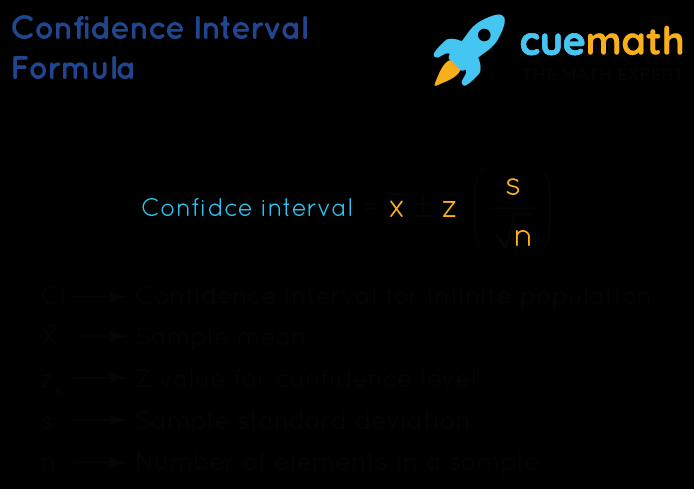
The general form of the confidence interval equation for a population mean is:
Here’s a breakdown of the components:
- : Sample mean
- : Z-score corresponding to the desired confidence level
- : Population standard deviation (or sample standard deviation if the population standard deviation is unknown)
- : Sample size
Let’s explore each component in more detail.
Sample Mean ()
The sample mean () is the average of all the data points in the sample. It serves as the point estimate for the population mean.
Z-Score (Z)
The Z-score is a statistical measure that represents the number of standard deviations a data point is from the mean. For confidence intervals, the Z-score corresponds to the desired confidence level. For example, a 95% confidence level has a Z-score of approximately 1.96, meaning that 95% of the area under the normal distribution curve falls within 1.96 standard deviations from the mean.
Common Z-scores for different confidence levels are:
- 90% Confidence Level: Z = 1.645
- 95% Confidence Level: Z = 1.96
- 99% Confidence Level: Z = 2.576
Population Standard Deviation ()
The population standard deviation () measures the dispersion of data points in the population. If the population standard deviation is unknown, the sample standard deviation (s) can be used as an estimate.
Sample Size (n)
The sample size (n) is the number of observations in the sample. A larger sample size generally leads to a more precise estimate of the population parameter.
Example Calculation
Suppose we want to calculate a 95% confidence interval for the mean weight of a sample of 30 apples. The sample mean weight is 150 grams, and the sample standard deviation is 10 grams.
Given:
- (for 95% confidence level)
Plugging these values into the confidence interval equation:
First, calculate the standard error:
Then, multiply by the Z-score:
Finally, determine the confidence interval:
This gives us:
So, we can be 95% confident that the true mean weight of the apples is between 146.41 grams and 153.59 grams.
Importance of Confidence Intervals
Confidence intervals provide a range of plausible values for population parameters, helping researchers and decision-makers to understand the precision and reliability of their estimates. Unlike point estimates, which provide a single value, confidence intervals account for variability and offer a more comprehensive view of the data.
Conclusion
The confidence interval equation is a vital tool in statistics, enabling the estimation of population parameters with an associated level of confidence. By understanding and applying this equation, researchers can make more informed decisions and better interpret their data. Whether in scientific research, business analysis, or everyday decision-making, confidence intervals play a crucial role in enhancing our understanding of uncertainty and variability.

Leave a Reply