Unlocking the Power of the t Value Formula in Statistical Analysis
Are you curious about the intricacies of statistical analysis? The t value formula is a powerful tool for understanding data, whether you’re an experienced researcher or just starting out. Let’s explore the t value formula and discover its practical applications together.
Understanding the t Value Formula
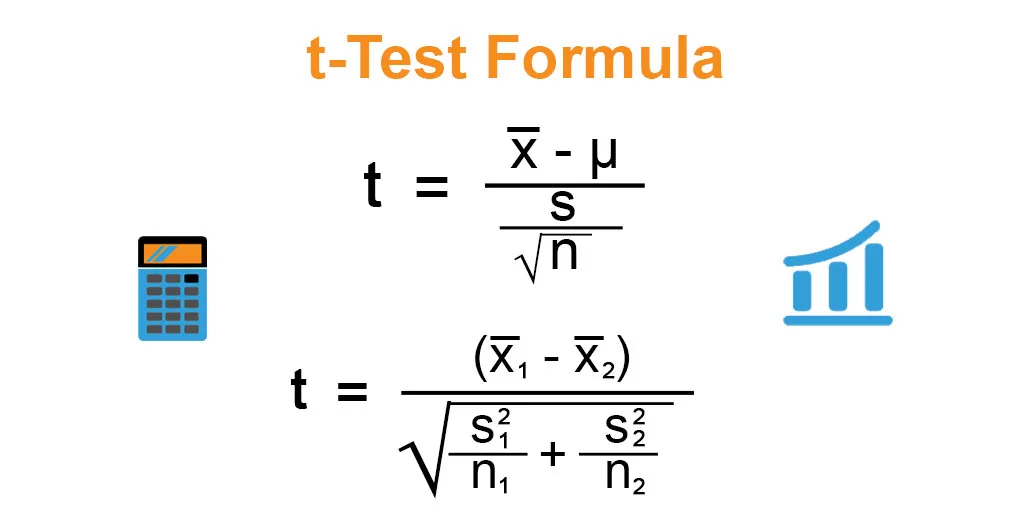
The t value formula is used to determine the significance of the difference between sample means. It accounts for the variability within each group, helping to identify whether an observed difference is due to true variation or random chance. This understanding is essential for making informed decisions based on data analysis.
Essentially, the t value measures how large the difference between groups is relative to the variability within each group. A larger t value indicates a lower likelihood that the difference occurred by chance, allowing researchers to draw meaningful conclusions and assess whether results are statistically significant.
Grasping the nuances of the t value formula empowers researchers to confidently interpret study findings and make sound recommendations based on solid statistical evidence.
When to Use the t Value Formula in Statistical Analysis
Knowing when to use the t value formula is crucial for accurate data interpretation. This formula is typically employed with small sample sizes or when the population standard deviation is unknown. It helps determine if the means of two groups are significantly different.
For instance, in scientific research or quality control processes with limited samples, the t value formula provides insights into whether observed differences are statistically significant. By calculating the t value and comparing it against critical values based on degrees of freedom and desired confidence levels, researchers can make informed decisions about their hypotheses.
Calculating the t Value
Calculating the t value is a critical step in statistical analysis. This involves determining the difference between sample means and assessing whether this difference is significant or simply due to random variation. To calculate the t value, you need the means of your samples, the standard deviations, and the sample sizes. These values are plugged into the formula to obtain the t statistic.
The t value indicates the likelihood that your results occurred by chance. A higher absolute t value increases confidence that there is a real difference between groups. Calculating this statistic correctly allows researchers to determine if their findings are statistically significant or just a result of randomness.
Examples of Situations Where the t Value Formula is Useful
Imagine conducting a study comparing the average test scores of two different groups of students. Using the t value formula, you can determine if there is a significant difference between the groups’ means. This tool is valuable when working with small sample sizes or when population standard deviations are unknown.
Another example is analyzing the effectiveness of a new drug treatment compared to a placebo. Calculating the t value helps assess whether observed differences in outcomes are statistically significant or due to chance.
In market research, businesses often use the t value formula to evaluate customer satisfaction levels before and after implementing changes. This helps make informed decisions based on solid statistical evidence rather than anecdotal observations.
Whether testing hypotheses in psychology, biology, economics, or any other field, understanding when and how to apply the t value formula provides valuable insights into your data analysis process.
Limitations and Considerations When Using the t Value Formula
When using the t value formula in statistical analysis, it’s essential to be aware of its limitations. One key aspect is that the t test assumes the data follows a normal distribution. Violating this assumption can lead to unreliable results. Additionally, small sample sizes may result in inaccurate conclusions.
Another consideration is understanding the difference between one-tailed and two-tailed tests. Choosing the appropriate type of test based on your research question is crucial for drawing valid conclusions. Outliers can significantly impact t test results, so addressing them appropriately is necessary to avoid skewed outcomes.
Mindfulness of these limitations ensures proper use and interpretation of the t value formula in statistical analysis.
Other Statistical Tests and When to Use Them
Exploring other statistical tests can provide valuable insights into data analysis. The chi-square test is useful for analyzing categorical data and determining significant associations between variables. ANOVA (Analysis of Variance) compares means across multiple groups to see if they are statistically different. Regression analysis helps understand relationships between variables and predict outcomes.
Non-parametric tests like the Mann-Whitney U test and Wilcoxon signed-rank test are suitable when assumptions of normality are violated. For more complex analyses involving interactions among factors, factorial ANOVA or MANOVA may be appropriate.
Each statistical test has unique strengths and applications, so choosing the right one depends on the research question and type of data being analyzed.
Summary
Understanding when to use the t value formula in statistical analysis is crucial for accurate data interpretation. By knowing how to calculate the t value and recognizing its limitations, researchers can make informed decisions about which statistical tests are most appropriate for their data. While the t value formula is valuable in many situations, considering other statistical tests ensures comprehensive analysis. Applying the right tools at the right time allows researchers to draw meaningful conclusions and contribute valuable insights to their fields of study.

Leave a Reply